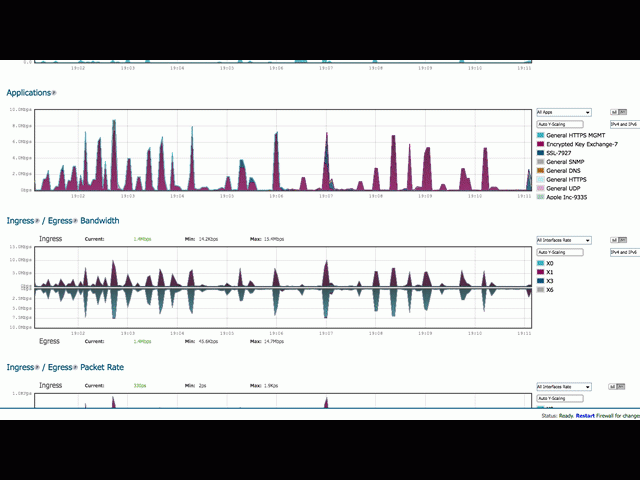
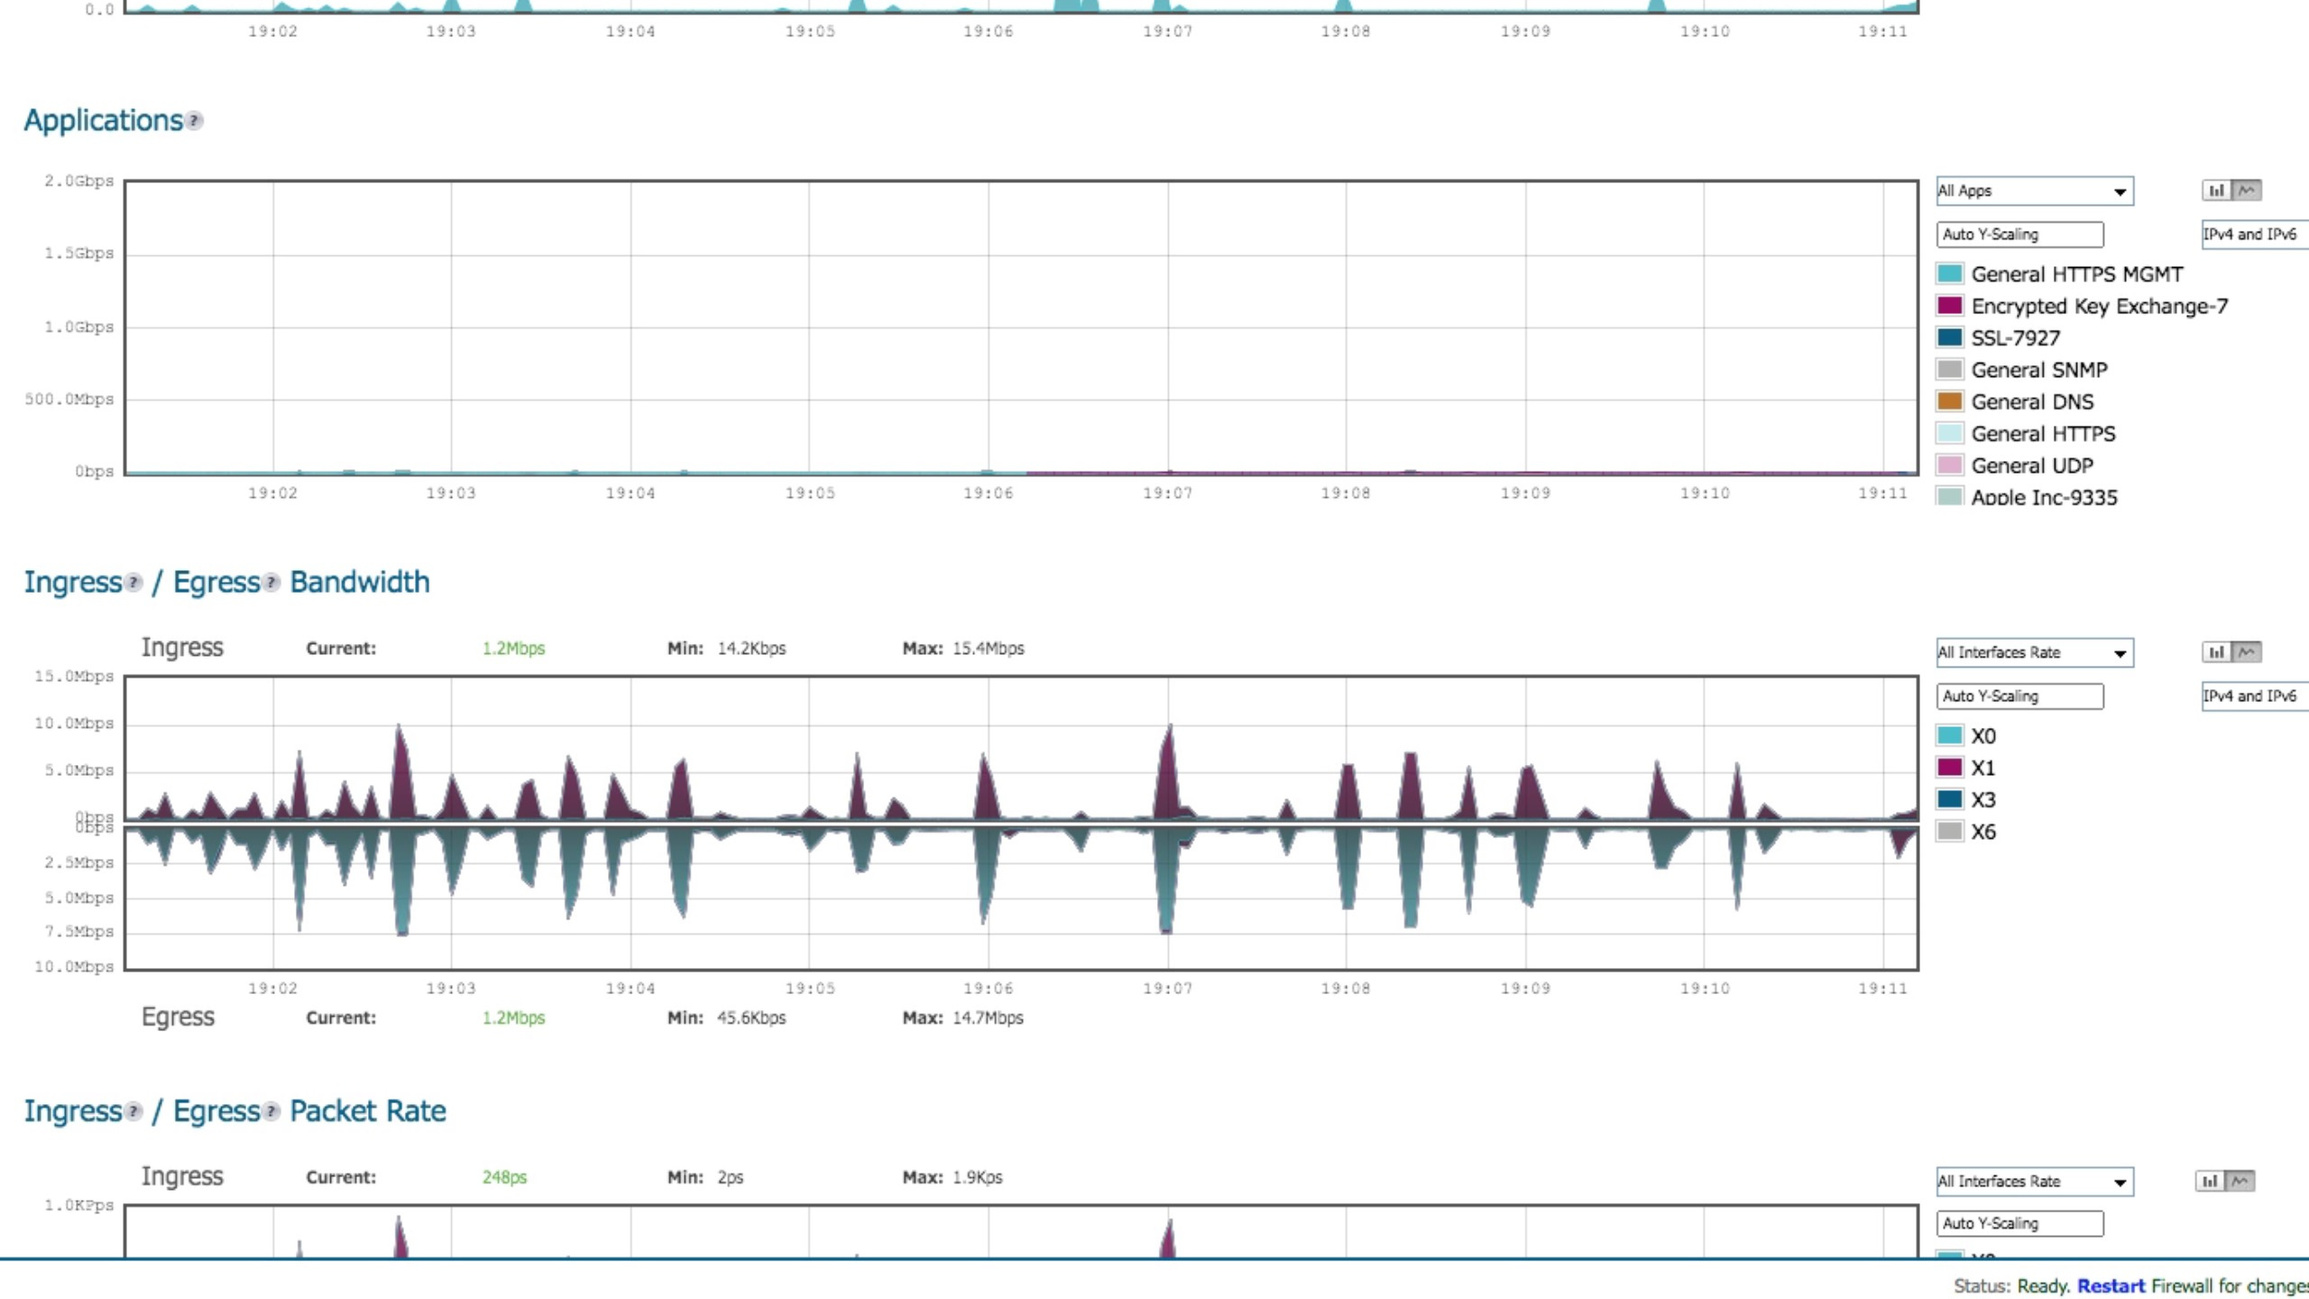
LiveMonitor - 1.21 Gigawatts Marty, or why it freaks out?
 BWC
Cybersecurity Overlord ✭✭✭
Hi,
since there was the Live Monitor available back in the 5.x days of SonicOS, i always experienced that this thing is showing weird values, and customers looked at me very confused.
For a weird reason the shown Bandwidth consumption jumps from a couple Mbps suddenly to Gbps, even I don't have this Bandwidth in any way at my disposal.
Is this just me? It happened for years on Gen5, Gen6 and all kinds of Firmware releases. This renders the Live Monitor useless.
--Michael@BWC
P.S.: Hopefully the gif is animated to show my point :)
Best Answer
-
CORRECT ANSWER
 BWC
Cybersecurity Overlord ✭✭✭
Hi all,
I solved the puzzle, it's because of the comma in the service name, the resulting JSON gets interpreted in a wrong way and the timestamp (i guess) is used as the bandwidth value.
This needs to get addressed, probably by setting the service name in quotes or not having comma as delimiter.
The browser requests the latest data to show from:
/getRTData.json?src=0&ipVerApps=2&ipVerBandwidth=2&_=1591108930168Which results in a JSON file with an applications / apps section containing something like this for a service in question:
|Service Eye-On-Health (tcp, 1000-65535),1591108675,52424|The value 1591108675 divided by 1024 is exactly the value that the Live Monitor shows me as used bandwidth for the service. But the correct value would be 52424, but because of the comma right behind tcp the parsing got messed up.
Case closed, Sherlock out :)
Please don't make me open a support case for this, hunting was all the fun :)
--Michael@BWC
1


Answers
Hey @BWC
Maybe try and choose "X1" instead of "ALL Interfaces" (which would include local traffic?)
Steph.
Hi @Halon5
I tried this sometimes before, but the screenshots are from my TZ 400 at home, where is no traffic at all across all interfaces. The interfaces are not selectable in the Applications graph, the Bandwidth on the interfaces are looking fine. So where comes the Application Gbps traffic from, if not from the interfaces? :)
--Michael@BWC
@BWC , it looks like the 'auto y scaling' (y-axis of the graph) is not working as expected -- you can see that the graph is not filled in and the colors are basically a small line at the bottom. This would be a good support case since I have not encountered it myself.
Hi @MasterRoshi
I think the whole calculation seems to be messed up, I was thinking of a locale issue (decimal point versus comma)? Even setting the y-axis to a fixed value still shows this abnormous values. BTW, it would be great if "All Interfaces Rates" would include VLAN interfaces as well when selecting Ingres/Engres Bandwidth.
It's somewhat funny noone complained about this before, because it's there for 10 or what years?
--Michael@BWC
On more thought, can it be because of the Service Object Name I chose? Do additional commas in the Service name cause trouble? I'll have to do further checking, but "Eye-On-Health (tcp, 1000-65535)" is on the top of my Application list most of the time, followed by some other custom Service names containing a comma.
Unfortunately renaming the Service Object gives not imminent results, because it seems the Flow Engine kinda caches the old Service name, already tried to clear caches on the diag.html, but no luck so far.
--Michael@BWC