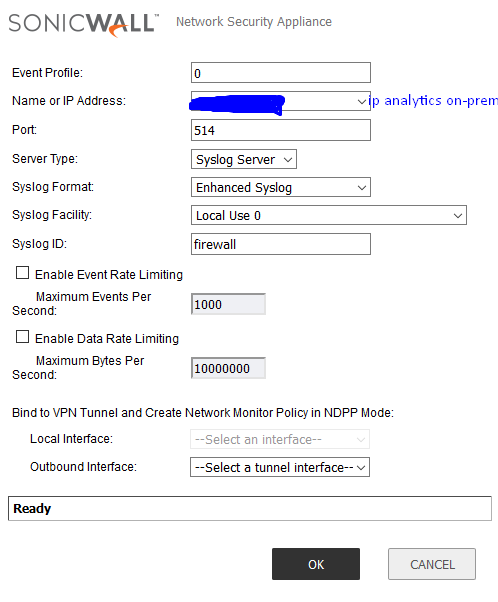
CSC connection failure with on-prem Analytics
Is there any other port used by on-site analytics? perform all the analytics release rules for ESX, but or CSC,
still has connection failures. I have already reviewed how syslog settings on the firewall.
As the ports used for clearance were 31031 and 514.
Category: Capture Security Center
1


Answers
Hello @ODANIELSANTIAGO__
I hope you are safe and well!
On-Prem analytics uses only ports such as TCP/UDP 31031 and UDP 514. As per your post, it seems like the communication between the firewall and analytics fail. More or less it seems like a connectivity issue here. I have listed few prerequisites and possible troubleshooting steps below. Hope these can help you to figure out to get the communication channel open between firewall and analytics.
Prerequisites:
Troubleshooting steps:
https://www.sonicwall.com/support/knowledge-base/how-can-i-setup-and-utilize-the-packet-monitor-feature-for-troubleshooting/170513143911627/
C:\Users>telnet analyticsIP 31031 || There should be a blank screen in the cmd prompt for a successful communication establishment.
Please check the recommendations, try the suggestions and let me know how it goes.
Thank you. Have a good day!!!
Regards
Saravanan V
Technical Support Advisor - Premier Services
Professional Services
Hi ODANIELSANTIAGO__,
Thanks for trying out the recommendations. I'm glad that you were able to try those.
As per the screenshot, the telnet seems to be unsuccessful for the TCP 31031 whereas for the other port UDP 514, the telnet test is not applicable since telnet is test meant for TCP ports.
As per the telnet results, its obvious that the communication between firewall and analytics doesnt happen for some reason.
My quick suggestion on this would be,
C:\Users>tracert analyticsIP
Please let me know how it goes.
Regards
Saravanan V
Regards
Saravanan V
Technical Support Advisor - Premier Services
Professional Services
My configuration for analytics on-prem
https://prnt.sc/s8komp
Hi ODANIELSANTIAGO__,
Thanks for sharing the results and analytics configuration.
As per the screenshots, looks like the connectivity is proper. But for some reason, the analytics connection status alone is not coming up. So, I recommend you doing a packet capture on the SonicWall firewall using packet monitor feature and on the analytics server using wireshark tool to dig more into the root cause and find a possible fix. It would be easier for you to go through the packet traces with our support team. You can lodge a support case for analytics product and contact the technical team using below web-link reference.
I hope this helps further!
Regards
Saravanan V
Regards
Saravanan V
Technical Support Advisor - Premier Services
Professional Services
From your initial post it looks like you are setup for sending syslogs to an on-prem deployment that is flow based. Please check if your on-prem license is for syslog or flow and make sure you deploy your server for what you are licensed for. If it is for flow based reporting then make sure GMS flow server settings are correct and that content filtering service is enabled. Hope this helps.
Hi, thanks for the reply, unfortunately I haven't been successful yet.
I reconfigured everything again,
On-prem as syslog based https://prnt.sc/sc8jd3
Enabled on mysonicwall as syslog analytics https://prnt.sc/sc8k0m
Thanks for the screen shots, the setup looks correct now. Make sure logging level on the firewall is set to 'inform' located at log>settings and confirm that syslogs are sent to the on-prem analytics. Also you need to add the unit to the on-prem analytics by clicking the '+' icon you see in tree control panel. If still an issue after that, please open a support case for further troubleshooting.
https://prnt.sc/sgqz8l
https://prnt.sc/sgqz8l