TZ670 - Control Plane Flood Protection Threshold Exceeded
Hi all,
I've got 2 x TZ670 SonicWall devices in HA installed at work. They are working as they should be. No reported issues on the network.
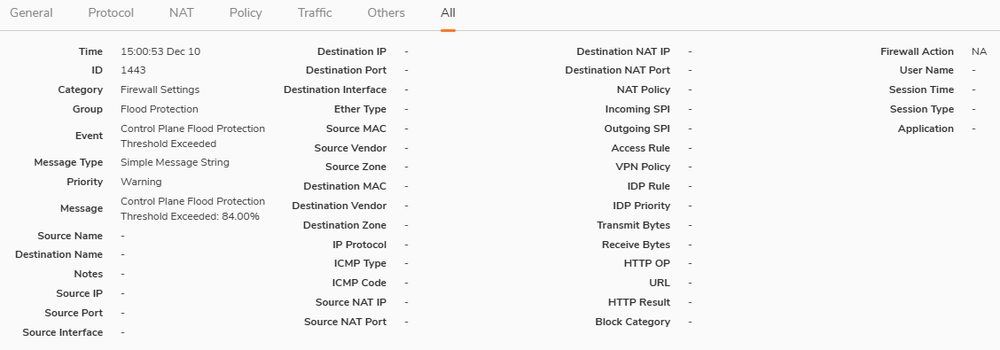
However, I can see a warning in the logs for "Control Plane Flood Protection Threshold Exceeded" The frustrating thing, is that the log gives no info on what might be causing it (image below). I know it is Core 0 that it relates to, but cannot find historic Core 0 data as I don't think that is a feature that the device has.
I've reached out to SonicWall support that recommended upping the threshold from 75% to 95% which in my mind is only masking an issue. We do not have DPI-SSL currently enabled and we have a very simple network topology.
2 x Ubiquiti Aggregate switch 10Gbe OM4 connections to the firewalls and the 2 x Ubiquiti Enterprise 48 Port 2.5 GBe switches.
Our incoming leased line is 500Mbps DL & 500Mbps UL.
We have approximately 50 workstations connected the switches on 1Gbe and 43 VOIP phones connected using POE.
Could it simply be a firmware issue or a false positive? Currently both running 7.1.1-7058-R6162
Any advice or help would be greatly appreciated.


Answers
Check your throughput stats, do you see these events coinciding with peaks in thoughput?
No Spikes in throughput. The highest throughput I have seen is 450mbps. The TZ670 is rated for 5.0Gbps without DPI-SSL.
Our maximum connections has never peaked over 17000 and the limit is 375000
Core 0 highest usage shows as 45%
The entire point of this feature is to protect the control plane from being overwhelmed with non-control traffic and slow the system management functions down.
https://www.sonicwall.com/support/technical-documentation/docs/sonicosx-7-0-0-0-firewall/Content/Firewall_Advanced/firewall-advanced-controlplane-floodprotection.htm
My understanding when the log entry is generated is that the control plane is dropping non-control traffic because the amount of non-control traffic on the control plane reached the remainder (25% of control plane) of the specified threshold (75%) - right?
AFAIK there is no historic control plane data in the UI (and no way to obtain core specific data via SNMP), and the only real way to see usage is on the System Dashboard under 'System Status \ Management Plane'.
The log entry is stating its protecting management functions, and supports suggestion is to INCREASE the threshold (in theory reducing the allowed amount of non-control traffic). Wait, wouldn't that also increase the number of times we see the log entry (since were only allowing the remainder and are already hitting it with a lower threshold)?
So really I don't think this setting is clear, nor does it function the way its understood to. I think the threshold is actually the usage amount of allowed non-control traffic to hit the control plane. So 75% means up to 75% usage of the control plane is allowed for non-control data.
Anyone else agree?
That's aggregate throughput when every physical interface is in use [eg 5 WANs and 5 LANs]. Don't expect to see those numbers in real life [real life = 1 LAN and 2 WANs, for example].
I am not 100% clear on what control plane traffic is. I assume using the management interface, pinging the firewall, fetching stats with SNMP, would all count. But that wouldn't scale linearly with payload throughput. One example of "using the management interface" would be, leaving SSH management enabled on WAN with no access control. Then it's being "used" whether you like it or not.
Finally, if you're not actually having issues, then maybe it doesn't matter :)
I always thought, all traffic went through Core0 and once you reached the threshold set it would then start to drop non-control traffic.
Maybe @MustafaA or @Community Manager could shed some light on how this feature actually functions.
The log entry is just a warning, it doesnt indicate anything bad is happening. It's not that it doesn't matter, if this was constantly being logged than something would be up. Our standard is protection is enabled @ 65% threshold and we see this warning regularly, not constantly. I figured 65% provides enough buffer either way the feature functions.